Trading success often lies in recognizing patterns that others miss. Among the most powerful tools available to modern traders are Fibonacci-based strategies, which harness mathematical principles discovered centuries ago to predict market movements with remarkable accuracy.
Understanding Fibonacci in Financial Markets
The mathematical sequence discovered by Leonardo de Pisa in the 12th century has found surprising relevance in today’s financial markets. This numerical pattern, where each number equals the sum of the two preceding numbers (1, 1, 2, 3, 5, 8, 13, 21…), creates ratios that appear consistently in market price movements.
The Core Fibonacci Ratios
When applied to trading, specific ratios derived from this sequence become crucial:
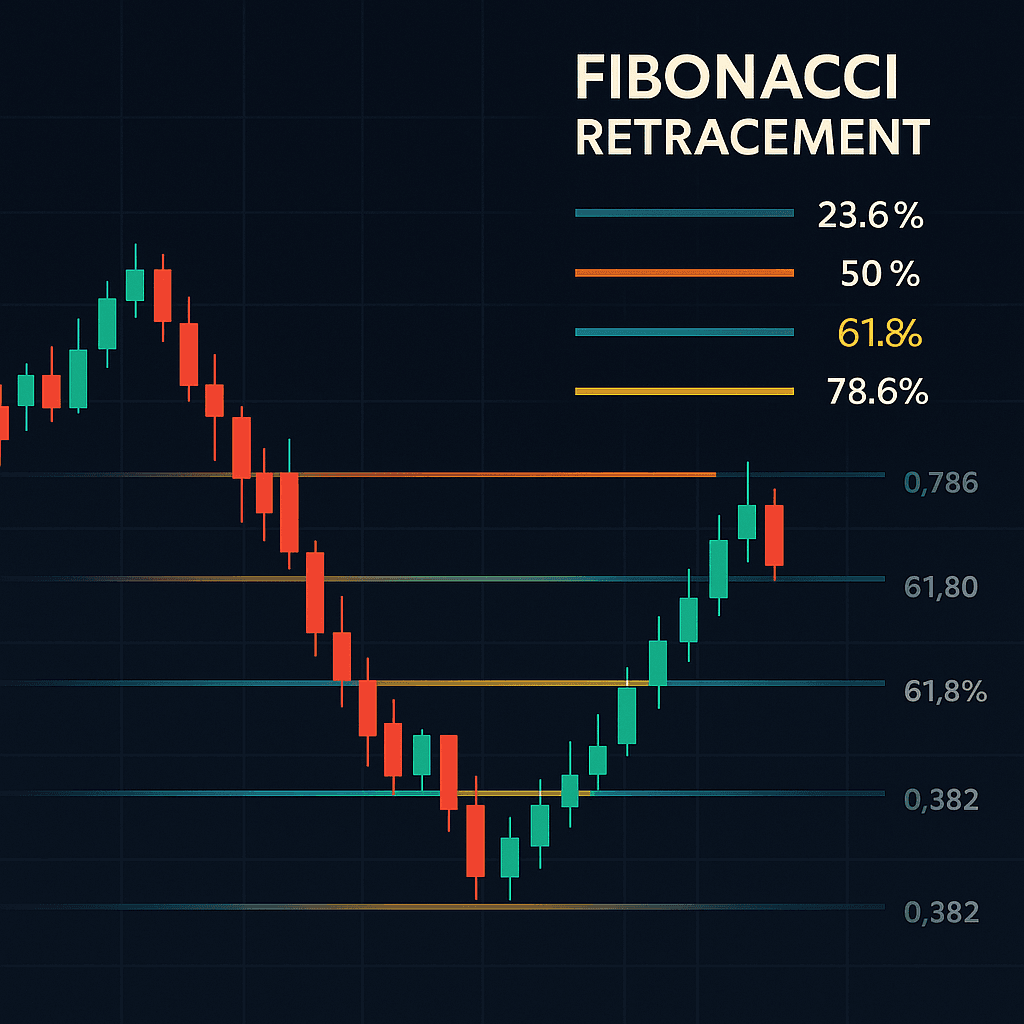
- 38.2% retracement level: Often marks initial support or resistance
- 50% retracement level: The psychological midpoint of price movements
- 61.8% retracement level: Known as the “golden ratio,” frequently acts as strong support/resistance
- 78.6% retracement level: The final barrier before significant breakouts
These percentages help traders identify where prices are likely to find support during pullbacks or resistance during rallies.
Strategy #1: The Support Reclaim Method
This approach focuses on identifying moments when previous support levels are broken and then reclaimed, creating low-risk entry opportunities.
How It Works
Markets often test support levels multiple times. When support breaks temporarily but then gets reclaimed, it typically becomes even stronger. This creates what professional traders call a “flush and reclaim” scenario.
Key Steps:
- Identify a significant Fibonacci retracement level (typically 38.2% or 61.8%)
- Watch for price to hold at this level initially
- If price breaks below but quickly recovers above the level, prepare for entry
- Enter long positions once price convincingly reclaims the Fibonacci level
- Set stops below the recent low for risk management
Real Market Application
Consider a stock that rallies from $40 to $50, then pulls back. The 38.2% retracement would be around $46.20. If the stock initially holds this level for several days, then briefly drops to $45 before surging back above $46.20, this creates an excellent low-risk buying opportunity.
The psychology behind this strategy is powerful: traders who bought the initial support get shaken out by the brief breakdown, reducing competition for new buyers when the level is reclaimed.
Strategy #2: The Momentum Breakout Approach
This technique capitalizes on the tendency for markets to accelerate once they break through the 78.6% retracement level, often completing the full 100% price swing rapidly.
The Mathematical Edge
When price reaches the 78.6% retracement level, it has already recovered most of its previous decline. Breaking above this level often triggers a rush to complete the remaining 21.4% move back to previous highs.
Implementation Steps:
- Identify a significant price swing (high to low or low to high)
- Draw Fibonacci retracements from the swing points
- Monitor price action as it approaches the 78.6% level
- Look for consolidation or sideways movement at this level
- Enter positions on a clear break above (uptrend) or below (downtrend) the 78.6% level
- Target the 100% retracement as your minimum profit objective
Why This Works
Markets exhibit parabolic behavior when approaching 100% retracements, almost as if there’s magnetic force pulling prices toward these levels. This creates opportunities for rapid profits over short timeframes.
Advanced Multi-Timeframe Analysis
Professional traders enhance their Fibonacci analysis by examining multiple timeframes simultaneously. This approach reveals hidden support and resistance levels that single-timeframe analysis might miss.
Combining Daily and Hourly Charts
For swing traders, the most effective combination typically involves:
- Daily charts: For identifying major Fibonacci levels and overall trend direction
- Hourly charts: For precise entry and exit timing
When Fibonacci levels align across different timeframes, they become significantly more reliable as support or resistance zones.
Integration with Other Technical Tools
Fibonacci analysis reaches peak effectiveness when combined with complementary technical indicators:
- Price Gaps: Fibonacci retracements often align with unfilled price gaps, creating stronger support/resistance zones.
- Moving Averages: Key moving averages frequently coincide with important Fibonacci levels, reinforcing their significance.
- Previous Highs and Lows: When Fibonacci levels align with prior significant price points, their predictive power increases substantially.
Risk Management and Best Practices
Position Sizing
Never risk more than 1-2% of your account on any single Fibonacci-based trade. The mathematical edge these strategies provide doesn’t eliminate market risk entirely.
Stop Loss Placement
- For Support Reclaim trades: Place stops 2-3% below the reclaimed Fibonacci level
- For Momentum Breakout trades: Use the 78.6% level as your stop once broken
Profit Taking
Consider taking partial profits at logical resistance levels while letting a portion of your position run toward the full target.
Common Pitfalls and How to Avoid Them
Over-Optimization
Don’t attempt to use every Fibonacci level on every chart. Focus on the most significant retracements from major price swings.
Ignoring Market Context
Fibonacci levels work best in trending markets. In choppy, sideways markets, these levels become less reliable.
Premature Entries
Wait for clear confirmation of support/resistance at Fibonacci levels rather than assuming they’ll hold simply because they exist.
Practical Implementation Timeline
- Week 1-2: Practice identifying major swing points and drawing Fibonacci retracements on historical charts.
- Week 3-4: Begin paper trading the Support Reclaim strategy on liquid stocks or ETFs.
- Week 5-6: Add the Momentum Breakout approach to your paper trading routine.
- Week 7-8: Start implementing with small position sizes using real money once you’ve demonstrated consistent paper trading success.
Conclusion
Fibonacci-based trading strategies offer a mathematical edge grounded in centuries-old numerical relationships that continue to manifest in modern financial markets. The Support Reclaim and Momentum Breakout approaches provide specific, actionable methods for capitalizing on these mathematical patterns.
Success with these strategies requires patience, discipline, and proper risk management. Start small, focus on quality setups over quantity, and allow the mathematical probabilities to work in your favor over time. When implemented correctly, these techniques can significantly enhance your trading performance while providing a structured approach to market analysis.
Remember that no trading strategy works 100% of the time, but Fibonacci analysis offers a robust framework for identifying high-probability opportunities that many market participants overlook. Master these concepts, and you’ll possess tools that can serve you well across all market conditions and timeframes.